Stay abreast of COVID-19 information and developments here
Provided by the South African National Department of Health
IHG: STILL ROOM
FOR GROWTH
After a highly traumatic three years following the outbreak of Covid-19, the global hotel industry has mostly fully recovered. Even business travel has returned to normal, in a stunning reversal from the predictions of most experts a year ago. Throughout the pandemic period, we held on to and even strengthened our position in InterContinental Hotels Group (IHG). Despite fears of a looming worldwide recession, we remain optimistic about the returns IHG can generate for investors over time.
IHG owns and operates 18 hotel brands (InterContinental Hotels, Holiday Inn, Regent, Six Senses, Crowne Plaza, Kimpton Hotels, voco and others). The company manages or franchises 6 179 hotels and 915 000 rooms worldwide. It doesn’t own the hotel properties and isn’t responsible for property costs or maintenance – it franchises its brands to hotel property owners on 20-year agreements and gets paid royalties on every night spent in the hotels, along with royalties on food and beverage spend.
If required, IHG also manages hotels for its franchisees. The franchisees use IHG brands, systems and access to IHG loyalty members (over 100 million of them), and this drives profitability for the franchisee, in exchange for paying royalties. This capital-light franchisor model results in high margins and strong cash flow generation for IHG.
The vast majority of business profit is generated in the US and Europe, though other regions like Asia and China are growing as emerging market populations become richer and start to travel more. IHG’s strategy is to grow by adding new hotels and rooms and increasing occupancy and room rates.
Profit margins improve over time as franchise margins are very high and franchise fees are an increasing part of the business mix. Most cash flow gets returned to shareholders in the form of buybacks and dividends.
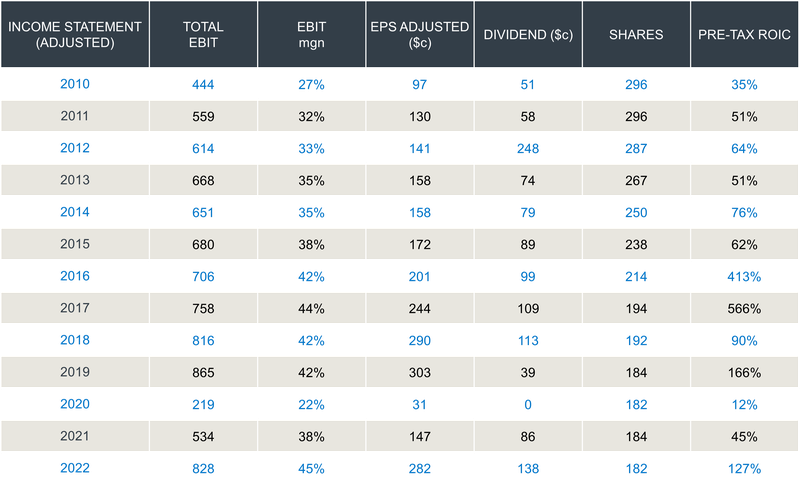
IHG results since 2010 are shown on the table below. The return on invested capital (ROIC) is extremely high. Earnings do jump around a bit given the cyclical nature of the hotel business, but the trend is up with earnings per share (EPS) having grown 8% a year in US dollars since 2007. Since it has little need for capital in the business, IHG has continually bought back stock (see the shrinking share count and rising EPS on the table) and increased the dividend. Every few years, it pays a large special dividend.
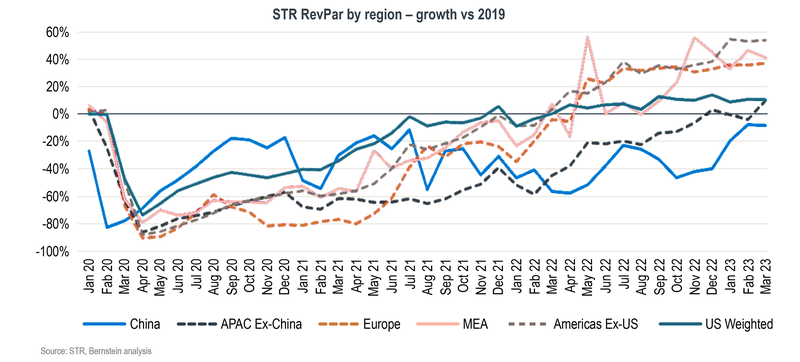
While we’re seeing some dramatic rises in the reported profits of hotel companies, this all comes off a very depressed base in 2020 and 2021. The best comparison is to see how hotel groups are faring compared to 2019. The chart below shows revenue per available room (RevPAR), the industry like-for-like number, compared to 2019. Most regions around the world have now fully recovered back to (or ahead of) 2019, apart from China, which is fast catching up. It’s a very healthy picture.
The main driver of the recovery is leisure travel, which has been very strong worldwide and is tracking well ahead of 2019 levels. Business travel has been the laggard, and not long ago a debate raged about whether it would ever return to normal with working from home the ‘new normal’. However, somewhat surprisingly, most major global hotel groups now report a complete recovery of business travel (Hyatt and Hilton business travel is ahead of 2019 levels, IHG is fully recovered since 2019, and Marriott is slightly behind 2019). This is a stunning reversal from the predictions of most experts even a year ago.
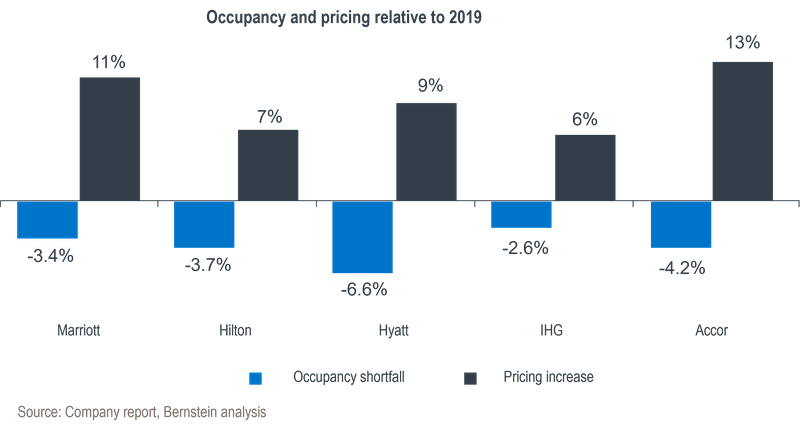
Digging a little bit deeper into hotel industry performance by hotel company (see the chart below) reveals the simple fact that while pricing per room is well ahead of 2019, occupancy has not yet fully recovered. It is, however, growing every quarter and should be a good tailwind for some time to come.
The most recent hotel company updates gave a good steer in terms of concerns around the consumer and recession fears. The good news is travel is, for now, holding up strongly and forward bookings are robust. While a recession would not be ideal, the hotel companies have shown their quality in how they have just come through the most severe stress test in their history with flying colours.
Key drivers of IHG’s business are the number of rooms, revenue per available room and margins. IHG now has 6 164 hotels and 911 000 rooms. Compared to 2019, hotels are up 4%, and rooms are up 3%. This is not as much growth as we’d hoped for, but it also incorporates a chunk of below-average hotels the company exited as it undertook a programme to improve the estate quality over the past few years (including a Russia exit). IHG is guiding to 4% room growth this year alone, which is very encouraging.
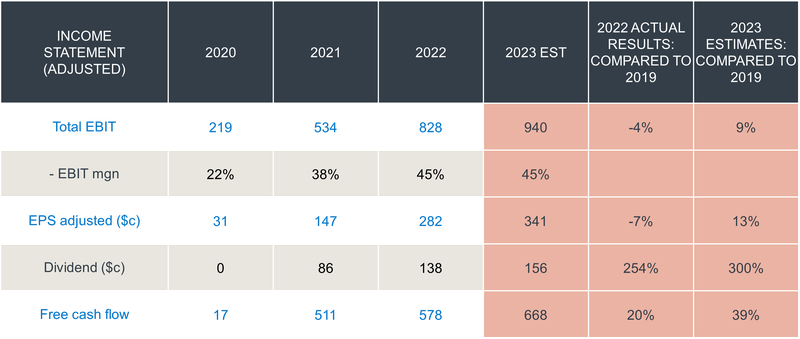
The table below shows that IHG managed to generate positive free cash flow of US$17 million in 2020. Though this was a big fall from 2019, it was a great achievement given it had periods in the year with much of its hotel estate shut down. The rebound in earnings and cash flows in 2021 and 2022 have been spectacular, though 2022 earnings still fell short of 2019. Nevertheless, a large buyback of US$750 million was announced in February this year and along with the dividend, IHG is expected to return up to 8% of the market cap this year alone.
2022 was still a reporting year with several countries shut down. With China and many other countries reopening in late 2022 or early 2023, IHG’s trading update for the first quarter of 2023 was excellent and room rates, occupancy and room growth are all moving up. Compared to the same quarter in 2019, it saw average pricing up 10%, with occupancy down only 2%.
If earnings estimates are broadly correct, 2023 operating profit will be around 9% ahead of 2019, earnings per share will be around 13% ahead and free cash flow will be 39% ahead. The dividend this year is expected to be 300% higher than 2019, and the buyback programme continues to shrink the share count.
It has been a highly disruptive and traumatic three years. Net-net, we think business progress has been satisfactory for IHG. While we would have liked to see more dependable growth in room numbers, the company is doing well and has come out of the pandemic in good shape.
Since March 2020, the shares have delivered a total return of 32.3% in pounds, while the MSCI World Index has delivered a total return of 40.5%. Since April 2021, the shares have delivered a total return of 11.4%, against the 16.6% of the MSCI World Index. While the returns are reasonable and positive in an absolute sense, the stock has not to date outperformed the world index.
At the current share price of £53, IHG continues to trade at a sizeable discount to what we think it is currently worth, which is around £66 a share. If our view of the future of the company and its cash flow generation is correct, the stock has 24% upside to fair value (which itself should grow over time) and should deliver extremely attractive total returns from here, at low risk for patient investors.
The shares remain cheap, we think, because fears of an impending worldwide recession have now overcome the positive momentum hotel companies are seeing as the world reopens. Our analysis suggests the current share price is pricing in a doomsday recession scenario an order of magnitude worse than Covid-19. There appears to be a large margin of safety in the purchase price of this high-quality business, and we remain optimistic about the returns IHG can generate for investors over time.
We constantly challenge the norm. Our investment process is a thorough and diligent one.
Michael York has spent 21 years in Investment Management.
Looking for a customised wealth plan? Leave your details and we’ll be in touch.
South Africa
South Africa Home Sanlam Investments Sanlam Private Wealth Glacier by Sanlam Sanlam BlueStarRest of Africa
Sanlam Namibia Sanlam Mozambique Sanlam Tanzania Sanlam Uganda Sanlam Swaziland Sanlam Kenya Sanlam Zambia Sanlam Private Wealth MauritiusGlobal
Global Investment SolutionsCopyright 2019 | All Rights Reserved by Sanlam Private Wealth | Terms of Use | Privacy Policy | Financial Advisory and Intermediary Services Act (FAIS) | Principles and Practices of Financial Management (PPFM). | Promotion of Access to Information Act (PAIA) | Conflicts of Interest Policy | Privacy Statement
Sanlam Private Wealth (Pty) Ltd, registration number 2000/023234/07, is a licensed Financial Services Provider (FSP 37473), a registered Credit Provider (NCRCP1867) and a member of the Johannesburg Stock Exchange (‘SPW’).
MANDATORY DISCLOSURE
All reasonable steps have been taken to ensure that the information on this website is accurate. The information does not constitute financial advice as contemplated in terms of FAIS. Professional financial advice should always be sought before making an investment decision.
INVESTMENT PORTFOLIOS
Participation in Sanlam Private Wealth Portfolios is a medium to long-term investment. The value of portfolios is subject to fluctuation and past performance is not a guide to future performance. Calculations are based on a lump sum investment with gross income reinvested on the ex-dividend date. The net of fee calculation assumes a 1.15% annual management charge and total trading costs of 1% (both inclusive of VAT) on the actual portfolio turnover. Actual investment performance will differ based on the fees applicable, the actual investment date and the date of reinvestment of income. A schedule of fees and maximum commissions is available upon request.
COLLECTIVE INVESTMENT SCHEMES
The Sanlam Group is a full member of the Association for Savings and Investment SA. Collective investment schemes are generally medium to long-term investments. Past performance is not a guide to future performance, and the value of investments / units / unit trusts may go down as well as up. A schedule of fees and charges and maximum commissions is available on request from the manager, Sanlam Collective Investments (RF) Pty Ltd, a registered and approved manager in collective investment schemes in securities (‘Manager’).
Collective investments are traded at ruling prices and can engage in borrowing and scrip lending. The manager does not provide any guarantee either with respect to the capital or the return of a portfolio. Collective investments are calculated on a net asset value basis, which is the total market value of all assets in a portfolio including any income accruals and less any deductible expenses such as audit fees, brokerage and service fees. Actual investment performance of a portfolio and an investor will differ depending on the initial fees applicable, the actual investment date, date of reinvestment of income and dividend withholding tax. Forward pricing is used.
The performance of portfolios depend on the underlying assets and variable market factors. Performance is based on NAV to NAV calculations with income reinvestments done on the ex-dividend date. Portfolios may invest in other unit trusts which levy their own fees and may result is a higher fee structure for Sanlam Private Wealth’s portfolios.
All portfolio options presented are approved collective investment schemes in terms of Collective Investment Schemes Control Act, No. 45 of 2002. Funds may from time to time invest in foreign countries and may have risks regarding liquidity, the repatriation of funds, political and macroeconomic situations, foreign exchange, tax, settlement, and the availability of information. The manager may close any portfolio to new investors in order to ensure efficient management according to applicable mandates.
The management of portfolios may be outsourced to financial services providers authorised in terms of FAIS.
TREATING CUSTOMERS FAIRLY (TCF)
As a business, Sanlam Private Wealth is committed to the principles of TCF, practicing a specific business philosophy that is based on client-centricity and treating customers fairly. Clients can be confident that TCF is central to what Sanlam Private Wealth does and can be reassured that Sanlam Private Wealth has a holistic wealth management product offering that is tailored to clients’ needs, and service that is of a professional standard.