Stay abreast of COVID-19 information and developments here
Provided by the South African National Department of Health
ALPHABET: AN
INNOVATOR OF NOTE
There have been several big winners in the artificial intelligence (AI) boom since the start of the year, with the leaders’ share prices spiking to record highs. One of our biggest holdings in this field is global technology company Alphabet Inc. We remain positive about this company’s prospects – in our view, Alphabet’s unparalleled technology platform and opportunities in multiple compelling growth verticals will enable it to generate free cash flow growth of high single digits over the next decade.
Alphabet has been an AI innovator for some years now, but AI is just one way in which the company is enhancing its business model over time. Its main business unit, Google, remains poised to benefit from the ongoing secular growth tailwinds in search and display advertising, as well the explosion of mobile users. In general, Google is uniquely positioned to outgrow the overall market due to continuous innovation in tools that should enhance its competitive position.
These often groundbreaking innovations include:
Google Maps: Since the early days of Street View, Google has stitched together billions of panoramic images so people can explore the world from their devices. One feature is Immersive View, which uses AI to create a high-fidelity representation of a place, enabling you to experience it before you visit. The scale on which Google Maps operates is simply breathtaking – it provides 20 billion kilometres of directions every day.
Google Photos: Another product made better by AI is Google Photos. Google introduced it in 2015 as one of its first AI-native products. Breakthroughs in machine learning have made it possible to search your photos for things like people, sunsets or waterfalls. More than 1.7 billion images are edited each month in Google Photos, and AI advancements have given users increasingly powerful ways to do this. For example, Magic Eraser, first launched on Google’s Pixel phones, uses AI-powered computational photography to remove unwanted elements in a picture.
PaLM 2: This stands for Pathways Language Model, version 2, and is a large language model (LLM) developed by Google AI. It is a successor to PaLM, which was introduced in 2022. This technology has far-reaching practical applications, including in the field of medical technology. Med-PaLM 2 enables fine-tuning in medical images and achieves a nine-times reduction in inaccurate reasoning when compared to the base model. It can synthesise information from medical imaging like plain films and mammograms.
Updates to Bard: Launched in March this year, Bard is Google’s experiment in the field of conversational AI. Bard supports a wide range of programming capabilities, and it has become much smarter at reasoning and maths prompts. It is now running on PaLM 2.
Alphabet is now trading at the most attractive levels in three years and given the quality of the business and its above-average growth prospects, we’re of the view that it shouldn’t be at a discount to the market. In its last quarterly update, Alphabet noted that in the face of an uncertain macro environment, Search remains resilient. It was pleasing to see a quarter-on-quarter increase in Search revenue.
GOOG reported Search & Other revenue of +2.1% year on year compared to the previous negative year-on-year rate. We expect Search & Other growth to accelerate as we progress through 2023. The PaLM model has enhanced Bard’s capabilities, enabling it to assist with programming and software development tasks, including code generation.
For developers, Alphabet released the PaLM application programming interface (API) to help programmers to start building generative AI applications more rapidly. The company has also improved bidding models to adjust for differences in search ad formats and has opened up the beta test for automatically created assets to all advertisers in English. In addition, Alphabet is bringing generative AI to customers across the cloud portfolio. All these new tools should enhance its competitive position.
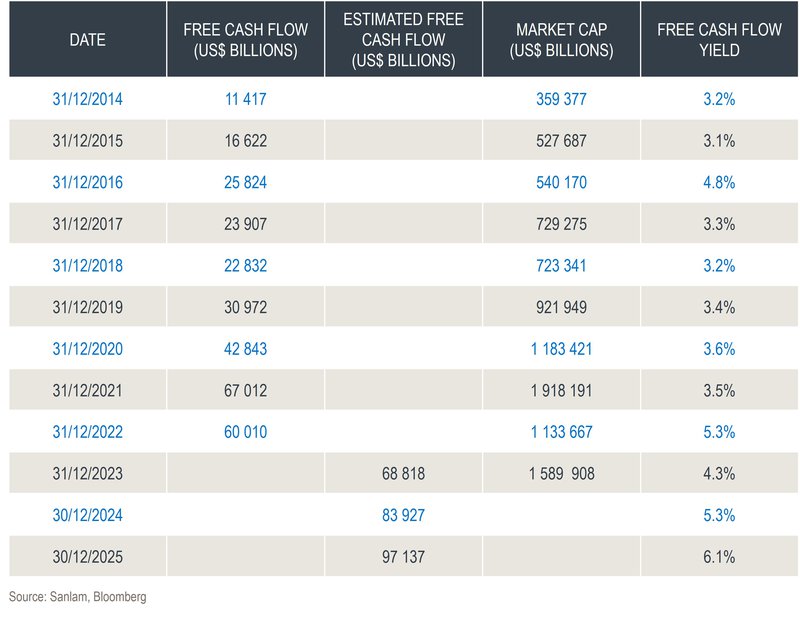
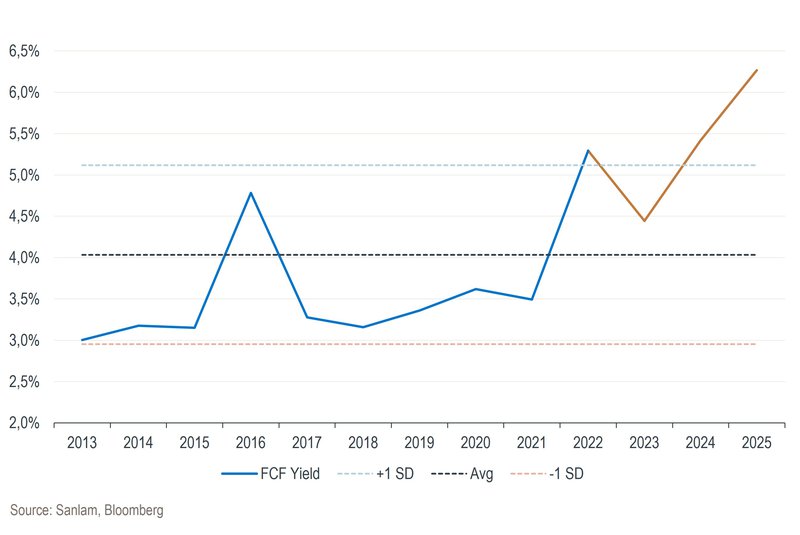
As can be seen on the table and the graph below, the free cash flow yield over time at each year end since 2014, when we first included Alphabet in the Sanlam Global High Quality Fund, shows that the stock was never in deep value territory. If the company can continue to grow free cash flow, the current valuation appears attractive based on a forward free cash flow yield of 6.1% by 2025.
Alphabet’s free cash flow, market cap and yield (2014-2025)

Free cash flow yield

We provide daily reporting of trades, monthly portfolio evaluations and annual tax reports to clients.
Riaan Gerber has spent 16 years in Investment Management.

Looking for a customised wealth plan? Leave your details and we’ll be in touch.
South Africa
South Africa Home Sanlam Investments Sanlam Private Wealth Glacier by Sanlam Sanlam BlueStarRest of Africa
Sanlam Namibia Sanlam Mozambique Sanlam Tanzania Sanlam Uganda Sanlam Swaziland Sanlam Kenya Sanlam Zambia Sanlam Private Wealth MauritiusGlobal
Global Investment SolutionsCopyright 2019 | All Rights Reserved by Sanlam Private Wealth | Terms of Use | Privacy Policy | Financial Advisory and Intermediary Services Act (FAIS) | Principles and Practices of Financial Management (PPFM). | Promotion of Access to Information Act (PAIA) | Conflicts of Interest Policy | Privacy Statement
Sanlam Private Wealth (Pty) Ltd, registration number 2000/023234/07, is a licensed Financial Services Provider (FSP 37473), a registered Credit Provider (NCRCP1867) and a member of the Johannesburg Stock Exchange (‘SPW’).
MANDATORY DISCLOSURE
All reasonable steps have been taken to ensure that the information on this website is accurate. The information does not constitute financial advice as contemplated in terms of FAIS. Professional financial advice should always be sought before making an investment decision.
INVESTMENT PORTFOLIOS
Participation in Sanlam Private Wealth Portfolios is a medium to long-term investment. The value of portfolios is subject to fluctuation and past performance is not a guide to future performance. Calculations are based on a lump sum investment with gross income reinvested on the ex-dividend date. The net of fee calculation assumes a 1.15% annual management charge and total trading costs of 1% (both inclusive of VAT) on the actual portfolio turnover. Actual investment performance will differ based on the fees applicable, the actual investment date and the date of reinvestment of income. A schedule of fees and maximum commissions is available upon request.
COLLECTIVE INVESTMENT SCHEMES
The Sanlam Group is a full member of the Association for Savings and Investment SA. Collective investment schemes are generally medium to long-term investments. Past performance is not a guide to future performance, and the value of investments / units / unit trusts may go down as well as up. A schedule of fees and charges and maximum commissions is available on request from the manager, Sanlam Collective Investments (RF) Pty Ltd, a registered and approved manager in collective investment schemes in securities (‘Manager’).
Collective investments are traded at ruling prices and can engage in borrowing and scrip lending. The manager does not provide any guarantee either with respect to the capital or the return of a portfolio. Collective investments are calculated on a net asset value basis, which is the total market value of all assets in a portfolio including any income accruals and less any deductible expenses such as audit fees, brokerage and service fees. Actual investment performance of a portfolio and an investor will differ depending on the initial fees applicable, the actual investment date, date of reinvestment of income and dividend withholding tax. Forward pricing is used.
The performance of portfolios depend on the underlying assets and variable market factors. Performance is based on NAV to NAV calculations with income reinvestments done on the ex-dividend date. Portfolios may invest in other unit trusts which levy their own fees and may result is a higher fee structure for Sanlam Private Wealth’s portfolios.
All portfolio options presented are approved collective investment schemes in terms of Collective Investment Schemes Control Act, No. 45 of 2002. Funds may from time to time invest in foreign countries and may have risks regarding liquidity, the repatriation of funds, political and macroeconomic situations, foreign exchange, tax, settlement, and the availability of information. The manager may close any portfolio to new investors in order to ensure efficient management according to applicable mandates.
The management of portfolios may be outsourced to financial services providers authorised in terms of FAIS.
TREATING CUSTOMERS FAIRLY (TCF)
As a business, Sanlam Private Wealth is committed to the principles of TCF, practicing a specific business philosophy that is based on client-centricity and treating customers fairly. Clients can be confident that TCF is central to what Sanlam Private Wealth does and can be reassured that Sanlam Private Wealth has a holistic wealth management product offering that is tailored to clients’ needs, and service that is of a professional standard.