Stay abreast of COVID-19 information and developments here
Provided by the South African National Department of Health
GLOBAL MINERS:
DIVERSIFICATION IS KEY
Industrial commodities have not escaped the impact of the COVID-19 crisis, but not all markets and miners have been impacted equally. Despite material disruptions at some of their mines, BHP and Anglo American – both of which we hold in our clients’ portfolios – have managed to emerge from the pandemic relatively unscathed. A major reason for this is that these two miners are highly diversified in terms of both commodity exposure and geography. Overall, we remain positive about both companies’ prospects.
The COVID-19 pandemic negatively impacted the demand for all industrial commodities, but not all markets were impacted equally. Commodities on which China has a greater import reliance (such as iron ore and copper) generally fared better than those where the country’s share of imported product is smaller (aluminium and metallurgical coal). This was largely due to a sharp recovery in Chinese demand since April. In general, energy-related commodities (notably thermal coal and oil) sold off sharply as energy usage in the transport and industrial sectors declined rapidly worldwide. Precious metals (gold and silver) performed well as investors rushed to safety.
As we argued in our recent article on platinum group metals (PGMs), in many cases both the demand and supply sides were impacted by the lockdowns, helping to stabilise prices even in the case of extreme demand disruptions (as with PGMs). Both iron ore and copper saw some virus-related stoppages, but not as severe as those affecting other, smaller commodities.
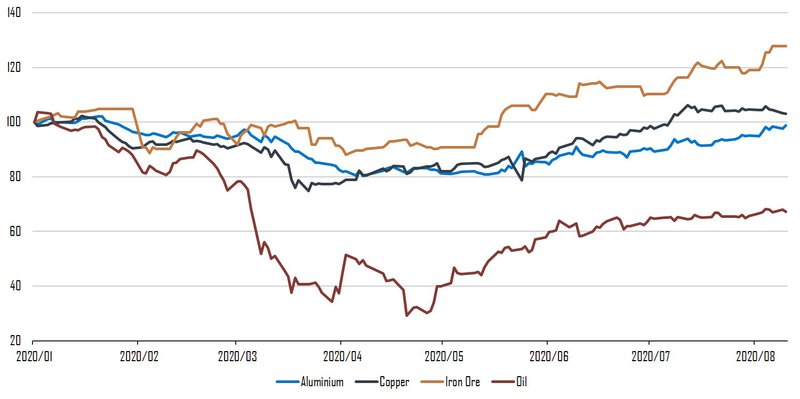
The prices of all major commodities have recovered off their lows of March and April, but the price performance has been divergent, as can be seen on the graph below. Oil prices are still more than 30% lower compared to the beginning of the year (so are the prices of thermal and metallurgical coal), while copper and aluminium have largely recovered their losses. Iron ore has been the star performer, up nearly 30% year to date at the time of writing.
Commodity price performance (1 Jan 2020 = 100)

Source: Igraph
In our portfolios, we hold positions in both BHP and Anglo American, two of the largest diversified miners in the world. Despite material disruptions at many of their mines, they were able to navigate their way through COVID-19 relatively unscathed (Anglo’s mines saw a bigger impact, however, due to large South African exposure and some operational disruptions at PGM and metallurgical coal mines). This was due to a number of reasons. Importantly, both companies did not enter the crisis with a lot of debt, which was a problem in 2015 (more so for Anglo than for BHP).
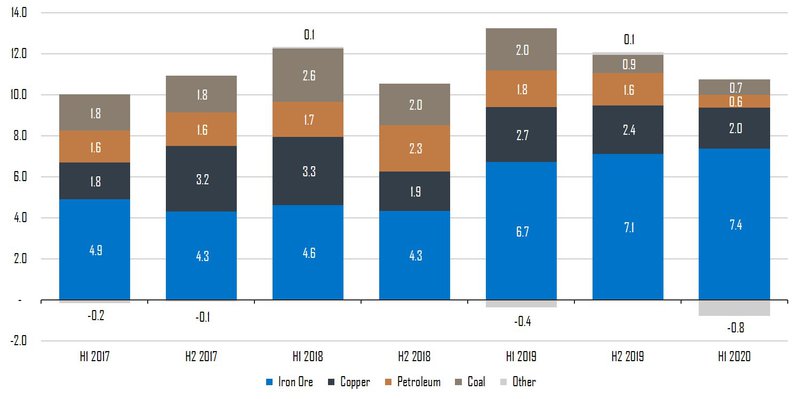
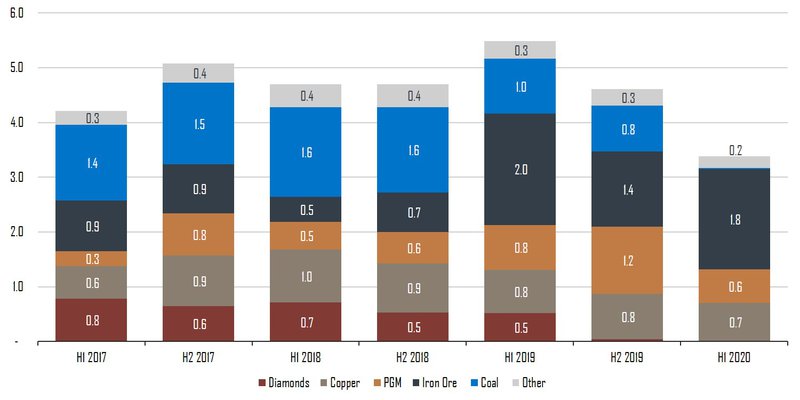
Another crucial reason is the diversified nature of the commodity exposure for both companies. In general, commodity prices are correlated, but as we’ve stated above, the price performance can often be quite divergent across the different products over the short term. For this reason, we prefer to have mining exposure in companies that are diversified both in terms of commodity and geography – where no single accident would be catastrophic to the company. This diversified model has worked well for both companies over the past few years, and the past six months were no exception, as can be seen on the graphs below:
BHP EBITDA split by commodity – US$bn

Past numbers exclude onshore shale assets sold in January 2019 for comparability. EBITDA: Earnings before interest, tax, depreciation and amortisation. Source: Company reports
Anglo EBITDA split by commodity – US$bn

Source: Company reports
While the level of commodity demand beyond COVID-19 remains uncertain, a few observations can be made on the prospects of the various commodity markets over the next decade. We’ll focus on copper and iron ore, two of the most important commodities for both BHP and Anglo American. (We recently wrote about oil and PGMs – the former is a growth area for BHP for the next few years, while Anglo has exposure to the latter through its subsidiary Anglo American Platinum.)
Copper usage has been forecast to grow over the next few decades as electric vehicles, renewable energy and energy storage applications require ever more of the commodity. Every year, just over 20 million tons of new copper is mined globally. Chile is the largest producer at about a quarter of world production, other major producers being the US, Peru and China. Over the past few decades the industry mine grade has decreased dramatically, as new mine finds have been rare and existing mines are ageing. This trend is expected to continue, steadily pushing up the average cost of mining copper over the next decade.
We believe that the combination of constrained supply and steadily growing demand means the outlook for copper prices is quite favourable, especially for miners with quality copper growth options, such as BHP and Anglo. BHP owns the majority of the Escondida mine in Chile, which at ~5% of global production is the largest in the world. In addition, the company is expanding its Pampa Norte (also in Chile) and Olympic Dam (Australia) mines. Anglo American owns stakes in two mines in Chile – Los Bronces and Collahuasi – both with exciting expansion potential. The company is also building a new mine in Peru, Quellaveco, which will add ~0.3 million tons of copper from 2022 onwards.
Iron ore is the primary ingredient used to make steel, which is widely used in real estate, infrastructure, cars and various household appliances. Global steel demand is about 1.8 billion tons per annum, of which China consumes ~60%.
China’s steel usage per capita is already quite high at over 700kg per capita, in line with levels at which the US, Japan and Germany peaked in the 1970s. This suggests that there is likely limited upside in the amount of steel used per annum over the next decade. However, China’s cumulative stock of steel – 10 tons per capita – is still low compared to the roughly 25 to 30 tons per capita of developed markets, suggesting that the current run rate can be maintained for many years to come.
Our base case is therefore that seaborne iron ore demand will be relatively flat over the next decade, as China’s level of steel consumption is unlikely to grow materially. Furthermore, its scrap steel usage is still low by global standards (~12% versus >40% in the developed world), which means less iron ore will be used even if the same level of steel consumption is maintained. In addition, it’s unlikely that other developing nations will be able to more than offset the expected decline in seaborne iron ore usage, purely as a result of China’s size. India, the only country with a population approaching that of China, has enough iron ore resources to meet its steel growth requirements.
Unlike copper, low-cost global iron ore resources are abundant and can be brought to market if needed. However, only a few producers from Australia and Brazil dominate the market, together producing 40% and 20% respectively of global supply (global production is 2.3 billion tons, of which China consumes ~1.4 billion tons, 80% of which is imported). This oligopolistic nature of seaborne supply (four producers supply ~70% of all ores) does help to cushion against negative impacts to demand.
Vale’s Brumadinho tailings dam disaster in Brazil early last year (leading to supply losses), combined with stronger-than-expected steel demand in China over the past two years, has helped prices surge to ~US$120 per ton of late. Over the next few years, as Vale’s supply returns, we believe that prices should move much lower, with incentive prices closer to ~US$60 per ton. BHP and Anglo will still make decent profits at these levels, with the former breaking even at ~US$30 per ton and the latter at just more than US$40 per ton.
BHP has one of the largest iron ore mining complexes in the world, in the Pilbara region of Australia. It can sustain current production levels of just more than 280 million tons per year for decades to come. Anglo American has two iron ore assets: Kumba in South Africa and Minas-Rio in Brazil. Kumba, despite its low remaining mine life, has done well to improve its cost competitiveness and has benefited from the trend to a better-quality product. Minas-Rio, which ended up being one of the world’s most expensive iron ore mines to build, is finally up and running and was one of the star performers over the past few months.
Overall, we remain positive about both BHP and Anglo American. Over the past few years, these companies have illustrated good capital discipline by not overinvesting in large new projects, focusing instead on smaller, fast-payback projects at existing assets and returning excess cash to shareholders. From a valuation perspective, both stocks are trading closer to our fair values and as a result, we have taken some profits after adding in March. We still maintain fairly large positions, however, as we believe the risk-reward profile remains in our favour.
Your wealth plan is designed with you in mind. Your financial reality, aspirations and risk profile.
Carl Schoeman has spent 22 years in Investment Management.

Looking for a customised wealth plan? Leave your details and we’ll be in touch.
South Africa
South Africa Home Sanlam Investments Sanlam Private Wealth Glacier by Sanlam Sanlam BlueStarRest of Africa
Sanlam Namibia Sanlam Mozambique Sanlam Tanzania Sanlam Uganda Sanlam Swaziland Sanlam Kenya Sanlam Zambia Sanlam Private Wealth MauritiusGlobal
Global Investment SolutionsCopyright 2019 | All Rights Reserved by Sanlam Private Wealth | Terms of Use | Privacy Policy | Financial Advisory and Intermediary Services Act (FAIS) | Principles and Practices of Financial Management (PPFM). | Promotion of Access to Information Act (PAIA) | Conflicts of Interest Policy | Privacy Statement
Sanlam Private Wealth (Pty) Ltd, registration number 2000/023234/07, is a licensed Financial Services Provider (FSP 37473), a registered Credit Provider (NCRCP1867) and a member of the Johannesburg Stock Exchange (‘SPW’).
MANDATORY DISCLOSURE
All reasonable steps have been taken to ensure that the information on this website is accurate. The information does not constitute financial advice as contemplated in terms of FAIS. Professional financial advice should always be sought before making an investment decision.
INVESTMENT PORTFOLIOS
Participation in Sanlam Private Wealth Portfolios is a medium to long-term investment. The value of portfolios is subject to fluctuation and past performance is not a guide to future performance. Calculations are based on a lump sum investment with gross income reinvested on the ex-dividend date. The net of fee calculation assumes a 1.15% annual management charge and total trading costs of 1% (both inclusive of VAT) on the actual portfolio turnover. Actual investment performance will differ based on the fees applicable, the actual investment date and the date of reinvestment of income. A schedule of fees and maximum commissions is available upon request.
COLLECTIVE INVESTMENT SCHEMES
The Sanlam Group is a full member of the Association for Savings and Investment SA. Collective investment schemes are generally medium to long-term investments. Past performance is not a guide to future performance, and the value of investments / units / unit trusts may go down as well as up. A schedule of fees and charges and maximum commissions is available on request from the manager, Sanlam Collective Investments (RF) Pty Ltd, a registered and approved manager in collective investment schemes in securities (‘Manager’).
Collective investments are traded at ruling prices and can engage in borrowing and scrip lending. The manager does not provide any guarantee either with respect to the capital or the return of a portfolio. Collective investments are calculated on a net asset value basis, which is the total market value of all assets in a portfolio including any income accruals and less any deductible expenses such as audit fees, brokerage and service fees. Actual investment performance of a portfolio and an investor will differ depending on the initial fees applicable, the actual investment date, date of reinvestment of income and dividend withholding tax. Forward pricing is used.
The performance of portfolios depend on the underlying assets and variable market factors. Performance is based on NAV to NAV calculations with income reinvestments done on the ex-dividend date. Portfolios may invest in other unit trusts which levy their own fees and may result is a higher fee structure for Sanlam Private Wealth’s portfolios.
All portfolio options presented are approved collective investment schemes in terms of Collective Investment Schemes Control Act, No. 45 of 2002. Funds may from time to time invest in foreign countries and may have risks regarding liquidity, the repatriation of funds, political and macroeconomic situations, foreign exchange, tax, settlement, and the availability of information. The manager may close any portfolio to new investors in order to ensure efficient management according to applicable mandates.
The management of portfolios may be outsourced to financial services providers authorised in terms of FAIS.
TREATING CUSTOMERS FAIRLY (TCF)
As a business, Sanlam Private Wealth is committed to the principles of TCF, practicing a specific business philosophy that is based on client-centricity and treating customers fairly. Clients can be confident that TCF is central to what Sanlam Private Wealth does and can be reassured that Sanlam Private Wealth has a holistic wealth management product offering that is tailored to clients’ needs, and service that is of a professional standard.