Stay abreast of COVID-19 information and developments here
Provided by the South African National Department of Health
RETIREMENT FUNDS:
HOW MUCH SHOULD YOU TAKE OFFSHORE?
Earlier this year, National Treasury amended Regulation 28 of the Pension Funds Act to increase the amount of exposure a retirement fund investor may have in offshore assets. While this is certainly a welcome development, an inconsiderate rush to externalise funds may have negative consequences for asset growth over the long term.
Previously, investors could invest up to 30% of their retirement fund assets offshore, plus an additional 10% in Africa outside South Africa. The offshore limit has now been increased to 45% of the portfolio anywhere outside South Africa.
This is good news for retirement fund investors – it allows for more freedom to diversify your portfolio globally. However, taking funds offshore at the wrong time in the investment cycle may well lead to long-term wealth destruction. For example, if you’d invested offshore in 2001 – when local sentiment and the rand were weak and South African assets had been underperforming compared to foreign markets for some time – you’d have suffered large losses in relative returns, as the local equity market outperformed global equities by 345% over the following 10 years. Investors should therefore guard against decision-making being driven only by recent experience.
With this cautionary note in mind, how should investors decide on the appropriate allocation to offshore assets in a South African multi-asset portfolio? A good starting point is to determine the structure of a long-term optimal portfolio that maximises expected return for a given level of risk – the so-called efficient frontier.
What is important in this regard is, first, to ascertain what each asset class is expected to deliver in terms of return and risk, and second, how we expect the different assets to move relative to each other. The foundation of a good portfolio is ensuring that the individual assets provide attractive risk-reward relationships, but also diversification by combining assets with low or negative correlation between them.
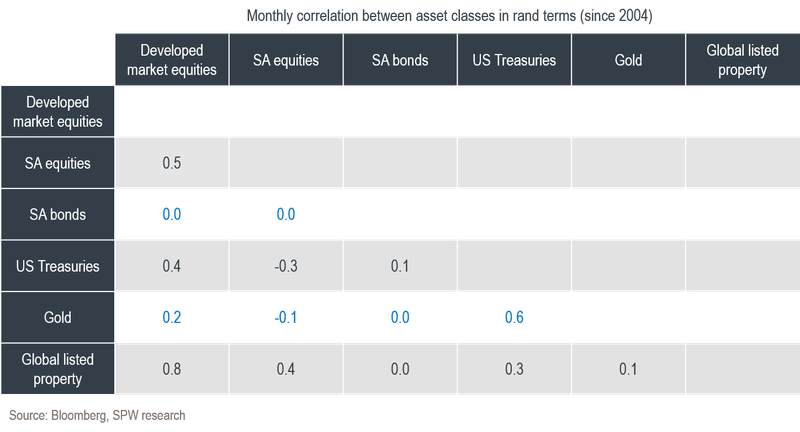
The table below shows the correlation between select major asset classes relevant to a South African retirement fund investor:

The table shows the diversification benefits (i.e. there is a low correlation between these assets) of owning gold or US Treasury bonds in combination with South African shares, as well as combining local bonds with developed market equities. Historically, the rand has tended to weaken during periods of market stress, providing some cushion to the returns of offshore assets.
With the rand often acting as a kind of shock absorber during market volatility, South African investors can improve the risk-reward relationship of their portfolio materially through global diversification. Diversification is said to be the only ‘free lunch’ in the investment world.
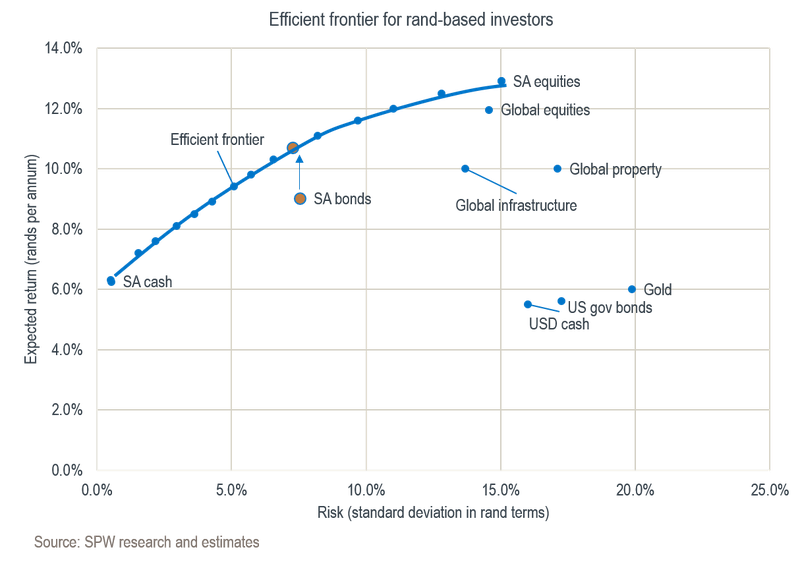
The chart below shows how an optimally blended portfolio – as shown by the efficient frontier – can provide investors with returns well above those of South African bonds without increasing the volatility of the returns. At Sanlam Private Wealth, we’ve been doing a lot of work on expanding our set of alternative strategies to move the efficient frontier even further to the top left of the chart.

Quantitative analysis suggests the optimal exposure to foreign assets to be in the 30-40% range at the risk level of a South African high-equity multi-asset portfolio, and 20-30% for a low-equity multi-asset portfolio. The previous 30% offshore limit in terms of Regulation 28 could therefore be viewed as resulting in a less-than-optimal portfolio, and the increased allowance should allow investors to improve the efficiency of their portfolios.
The figures set out above should provide guidance for long-term strategic asset allocation. However, at times when there is wide dispersion in valuation levels across asset classes – the primary driver of future expected returns – consideration should be given to medium-term tactical tilts.
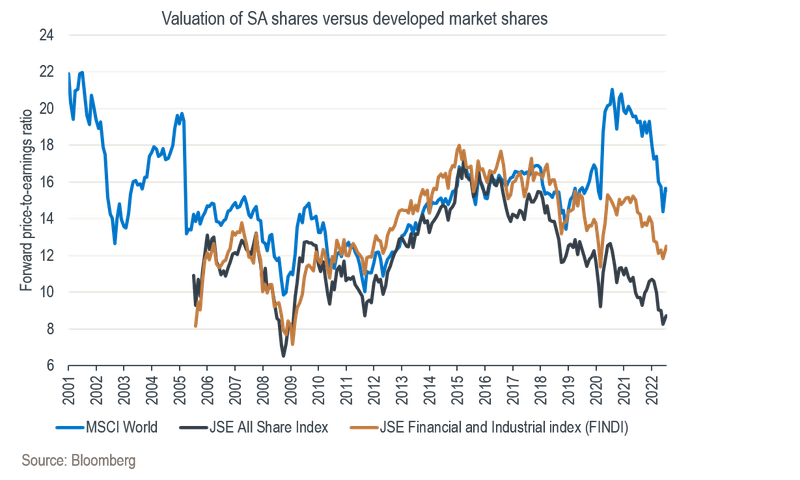
For example, the chart below shows the forward price-to-earnings (P/E) ratio of South African shares versus developed market shares. One could argue that the elevated prices of commodities have artificially depressed the forward P/E ratio of the local market, and we therefore also include the ratio for the JSE Financials and Industrials Index (FINDI), which excludes mining shares. It is noteworthy how local shares have become relatively cheap versus developed market shares since 2015.

The local versus offshore debate should also consider the investment cycle, with commodity prices playing a crucial role in determining the relative performance of South African assets versus global assets. Local shares have historically outperformed in periods of high commodity inflation.
Turning to fixed interest, we’ve now finally started to see a reversal of the multi-decade decline in yields in most of the developed world. However, inflation-adjusted yields in our local bond market remain attractive relative to developed markets. For example, investors in 10-year inflation-linked South African government bonds will receive a yield of 4.1% above local inflation, compared to only 0.3% in the US and a negative 1.4% in Germany.
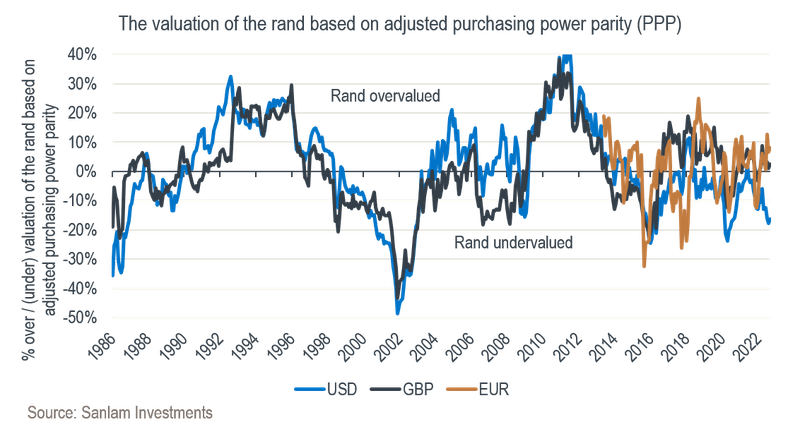
The strength of the rand when funds are externalised will also have a long-term impact on investment performance. Ideally, one wants to buy offshore assets when you have a strong local currency with which to buy them. We have found the purchasing power parity (PPP) rate (adjusted for the historical risk premia associated with the rand) to be a good indicator of the long-term fair value of our currency. The chart below shows how the rand has traded relative to this measure. At present, it seems to be slightly overvalued relative to the euro and pound (favouring increased allocation to these currencies), while being around 15% undervalued to the US dollar.

In summary, while the higher foreign investment limit in retirement fund portfolios improves the opportunity set for investors, it does come after a period of sustained underperformance of our local market relative to global markets, in particular the US. With relatively attractive valuation levels and higher interest rates in South Africa, as well as a history of outperformance during global inflationary periods, the stage looks set for an improved relative performance of local assets.
On the other hand, South Africa remains very small in terms of the global investment opportunity set, and carries its own country-specific risks and structural challenges. By widening the investment universe, we believe that we can still position the portfolios for our view of the investment cycle, find undervalued assets and diversify South Africa-specific risk.
At Sanlam Private Wealth, we’ll continue to actively manage our Regulation 28-compliant portfolios and seek to capitalise on the revised investment parameters in a prudent manner. We’ll also ensure that the portfolios are well diversified to navigate a world in which unexpected events are likely to arise – which often create new opportunities for investment.
When formulating your investment strategy, we focus on your specific needs, life stage and risk appetite.
Greg Stothart has spent 16 years in Investment Management.

Looking for a customised wealth plan? Leave your details and we’ll be in touch.
South Africa
South Africa Home Sanlam Investments Sanlam Private Wealth Glacier by Sanlam Sanlam BlueStarRest of Africa
Sanlam Namibia Sanlam Mozambique Sanlam Tanzania Sanlam Uganda Sanlam Swaziland Sanlam Kenya Sanlam Zambia Sanlam Private Wealth MauritiusGlobal
Global Investment SolutionsCopyright 2019 | All Rights Reserved by Sanlam Private Wealth | Terms of Use | Privacy Policy | Financial Advisory and Intermediary Services Act (FAIS) | Principles and Practices of Financial Management (PPFM). | Promotion of Access to Information Act (PAIA) | Conflicts of Interest Policy | Privacy Statement
Sanlam Private Wealth (Pty) Ltd, registration number 2000/023234/07, is a licensed Financial Services Provider (FSP 37473), a registered Credit Provider (NCRCP1867) and a member of the Johannesburg Stock Exchange (‘SPW’).
MANDATORY DISCLOSURE
All reasonable steps have been taken to ensure that the information on this website is accurate. The information does not constitute financial advice as contemplated in terms of FAIS. Professional financial advice should always be sought before making an investment decision.
INVESTMENT PORTFOLIOS
Participation in Sanlam Private Wealth Portfolios is a medium to long-term investment. The value of portfolios is subject to fluctuation and past performance is not a guide to future performance. Calculations are based on a lump sum investment with gross income reinvested on the ex-dividend date. The net of fee calculation assumes a 1.15% annual management charge and total trading costs of 1% (both inclusive of VAT) on the actual portfolio turnover. Actual investment performance will differ based on the fees applicable, the actual investment date and the date of reinvestment of income. A schedule of fees and maximum commissions is available upon request.
COLLECTIVE INVESTMENT SCHEMES
The Sanlam Group is a full member of the Association for Savings and Investment SA. Collective investment schemes are generally medium to long-term investments. Past performance is not a guide to future performance, and the value of investments / units / unit trusts may go down as well as up. A schedule of fees and charges and maximum commissions is available on request from the manager, Sanlam Collective Investments (RF) Pty Ltd, a registered and approved manager in collective investment schemes in securities (‘Manager’).
Collective investments are traded at ruling prices and can engage in borrowing and scrip lending. The manager does not provide any guarantee either with respect to the capital or the return of a portfolio. Collective investments are calculated on a net asset value basis, which is the total market value of all assets in a portfolio including any income accruals and less any deductible expenses such as audit fees, brokerage and service fees. Actual investment performance of a portfolio and an investor will differ depending on the initial fees applicable, the actual investment date, date of reinvestment of income and dividend withholding tax. Forward pricing is used.
The performance of portfolios depend on the underlying assets and variable market factors. Performance is based on NAV to NAV calculations with income reinvestments done on the ex-dividend date. Portfolios may invest in other unit trusts which levy their own fees and may result is a higher fee structure for Sanlam Private Wealth’s portfolios.
All portfolio options presented are approved collective investment schemes in terms of Collective Investment Schemes Control Act, No. 45 of 2002. Funds may from time to time invest in foreign countries and may have risks regarding liquidity, the repatriation of funds, political and macroeconomic situations, foreign exchange, tax, settlement, and the availability of information. The manager may close any portfolio to new investors in order to ensure efficient management according to applicable mandates.
The management of portfolios may be outsourced to financial services providers authorised in terms of FAIS.
TREATING CUSTOMERS FAIRLY (TCF)
As a business, Sanlam Private Wealth is committed to the principles of TCF, practicing a specific business philosophy that is based on client-centricity and treating customers fairly. Clients can be confident that TCF is central to what Sanlam Private Wealth does and can be reassured that Sanlam Private Wealth has a holistic wealth management product offering that is tailored to clients’ needs, and service that is of a professional standard.