Stay abreast of COVID-19 information and developments here
Provided by the South African National Department of Health
SA BANKS REMAIN RESILIENT
DESPITE CHALLENGES
Despite banking share valuations hitting 20-year lows in the aftermath of the Covid-19 crisis, South African banks have proven to be remarkably resilient businesses. We’ve seen a notable earnings recovery in the sector over the past 12 months, and we expect continued good results for the remainder of 2022. While we still favour the sector, we have, however, been reducing the exposure to banking shares in our clients’ portfolios – in line with our valuation-based approach.
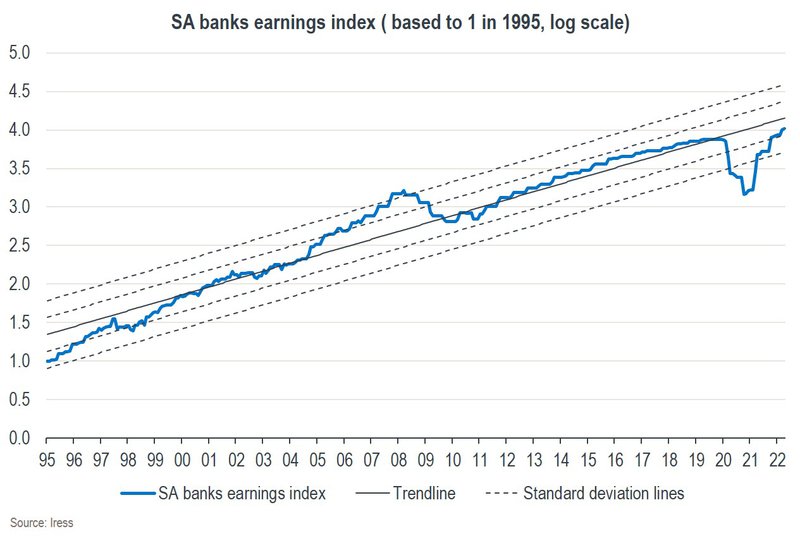
While occasionally disrupted by macro-economic events such as the global financial crisis in 2008 and the Covid-19 pandemic in 2020, South African banks have over time proven to be robust businesses, with stable – and growing – earnings profiles, as can be seen on the chart below. However, while earnings have recovered to pre-pandemic levels, we are yet to see these businesses return to their trendline earnings growth of 11.5% per annum exhibited since 1995.

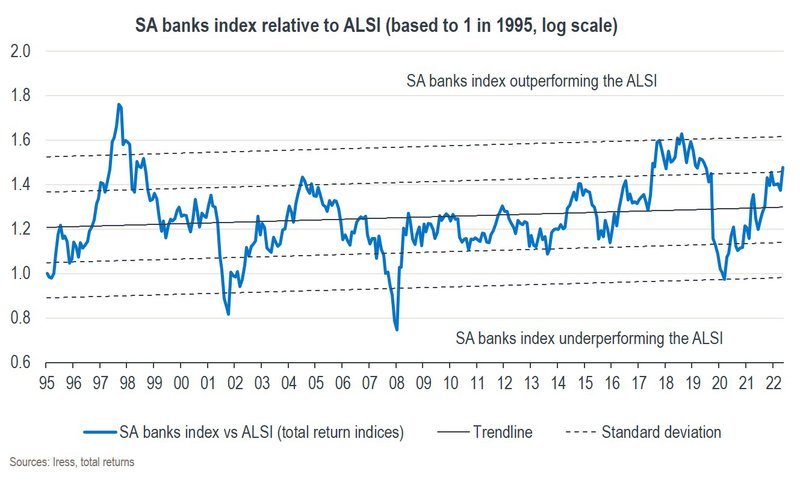
In the most recent crisis, the fallout from the pandemic certainly impacted earnings in the sector, mainly through bad debts and high provisioning. Since the historic lows of March 2020, however, banking shares have posted a stellar recovery, outperforming the JSE All Share Index (ALSI) by 42% over the period.
What has made the banking sector so resilient when other industries have floundered in a materially deteriorating macro-economic environment? One alluring aspect of the sector is its captive market – banks are intricately linked to the functioning of an economy. As markets formalise and grow, both individuals and businesses require bank accounts to participate and benefit. Another area of growth is the funding of renewable infrastructure, a new source of revenue for South African banks.
Although South Africa has high banking penetration, financial inclusion is low. A sizeable informal sector currently driven by cash transactions and a large cohort of unbanked individuals provide both a runway for the future growth of existing banks and the proving ground for challengers in the sector.
In recent years, we’ve seen several low-cost digital banks (with no bricks-and-mortar branch network), powered by newer financial technologies, enter the market with the aim of disrupting the industry. The challenger banks’ competitive advantage is that they can automate the transactional side of banking and offer lower fees, putting pressure on traditional banks’ non-interest revenue. This has increased competition as more previously excluded people are drawn into the financial system, increasing the size of the pie for everyone.
We’ve also seen an increase in the use of mobile money. This is a pay-as-you-go digital service using mobile money accounts offered to clients by a mobile network operator (such as MTN’s MoMo or Vodacom’s M-Pesa) or another entity partnering with an operator, which are independent of the traditional banking network. Mobile money services have also increased access to the financial system for previously unbanked individuals.
While these offerings have grown client numbers, the large traditional banks still account for more than 95% of loans and deposits within the banking system. The big players continue to own the profit pool and have the resources to defend their position.
Although banks provide many services to their customers in the modern economy, they primarily make money by accepting deposits from savers and lending to borrowers. Earnings are driven by three elements:
South African banks are currently in a profitability sweet spot, as they are benefiting from rising rates but are not yet experiencing the pain of increased bad debts. There’s a direct link between a change in interest rates and the profitability of banks, known as the endowment effect: when interest rates are rising, banks make more money seen through the net interest income line on the income statement.
The endowment effect is heightened by several factors, one of which is what are called ‘lazy’ deposits – when customers leave their cash in a savings or cheque account that earns a low interest rate (for example, Standard Bank at 3.85%), and the bank then lends it to another customer at the prime rate (currently 9.75%), earning the difference. The interest rates earned on these lazy deposits typically do not adjust as quickly as or equally to the prime lending rate.
These deposits have grown by more than 30% since December 2019, accounting for around 60% of total deposits in the banking system, according to South African Reserve Bank data. The prime lending rate has increased from 7% to 9.75% since October 2021 and is set to rise further in the coming months.
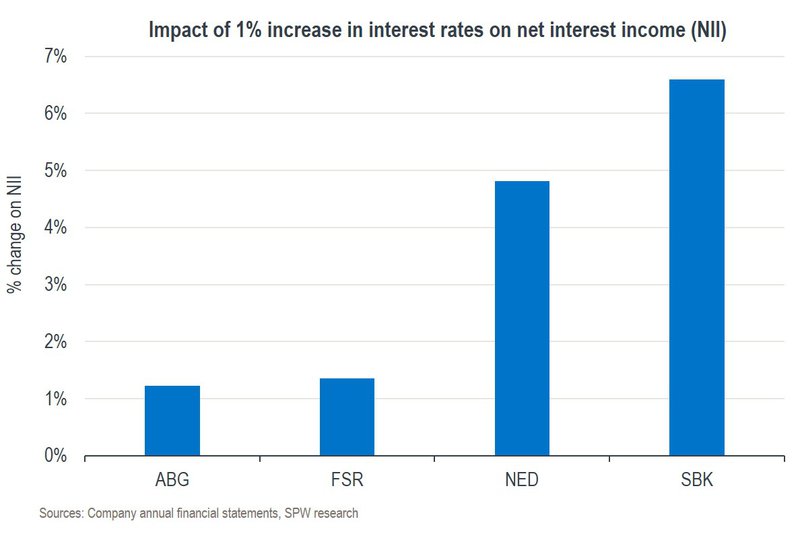
In terms of sensitivity to rate changes, not all banks are affected equally. The chart below illustrates our view of the effect of interest rate changes on the ‘big four’ South African banks. According to our research, holding other things constant, a 1% rise in interest rates over a 12-month period will see Standard Bank’s net interest income rise by more than 6%, making it the most sensitive to the rate hiking cycle.

While South African banks have recovered markedly since their post-Covid-19 lows, and there may still be opportunities in these shares, at Sanlam Private Wealth we’re of the view that, going forward, we may not continue to see the same level of outperformance demonstrated recently.
As a result of the integration of banks within an economy, the macro environment plays an important role in the expectation of returns in the sector. The global energy crisis, rising rates, consumer fragility and South Africa’s impending greylisting by the Financial Action Task Force will start to weigh on the sector as investors consider the repercussions for local growth.
Even though our banks are exhibiting resilient earnings and are well capitalised, they are particularly exposed to tail risks given their gearing and reliance on general consumer and business confidence. The high levels of volatility of banking share prices during economic and political uncertainty do, however, create opportunities for investors.
The chart below displays the relative performance of the South African banks index versus the ALSI. It illustrates the outperformance of the banking index over the past two years but, more interestingly, also the many opportunities investors have had to trade banks relative to the ALSI, particularly around times of economic distress.

In the aftermath of the Covid-19 crisis, we made use of the opportunity to selectively add banking shares to our clients’ portfolios. In general, we expect continued good earnings results for the remainder of this year. However, while we still favour the sector, we have been reducing exposure to it in the portfolios, in line with our valuation-based investment approach. Our focus has shifted to the risks as we wait to take advantage of expected cheaper entry points in this sector in future to enhance returns in our clients’ portfolios.
When formulating your investment strategy, we focus on your specific needs, life stage and risk appetite.
Greg Stothart has spent 16 years in Investment Management.

Looking for a customised wealth plan? Leave your details and we’ll be in touch.
South Africa
South Africa Home Sanlam Investments Sanlam Private Wealth Glacier by Sanlam Sanlam BlueStarRest of Africa
Sanlam Namibia Sanlam Mozambique Sanlam Tanzania Sanlam Uganda Sanlam Swaziland Sanlam Kenya Sanlam Zambia Sanlam Private Wealth MauritiusGlobal
Global Investment SolutionsCopyright 2019 | All Rights Reserved by Sanlam Private Wealth | Terms of Use | Privacy Policy | Financial Advisory and Intermediary Services Act (FAIS) | Principles and Practices of Financial Management (PPFM). | Promotion of Access to Information Act (PAIA) | Conflicts of Interest Policy | Privacy Statement
Sanlam Private Wealth (Pty) Ltd, registration number 2000/023234/07, is a licensed Financial Services Provider (FSP 37473), a registered Credit Provider (NCRCP1867) and a member of the Johannesburg Stock Exchange (‘SPW’).
MANDATORY DISCLOSURE
All reasonable steps have been taken to ensure that the information on this website is accurate. The information does not constitute financial advice as contemplated in terms of FAIS. Professional financial advice should always be sought before making an investment decision.
INVESTMENT PORTFOLIOS
Participation in Sanlam Private Wealth Portfolios is a medium to long-term investment. The value of portfolios is subject to fluctuation and past performance is not a guide to future performance. Calculations are based on a lump sum investment with gross income reinvested on the ex-dividend date. The net of fee calculation assumes a 1.15% annual management charge and total trading costs of 1% (both inclusive of VAT) on the actual portfolio turnover. Actual investment performance will differ based on the fees applicable, the actual investment date and the date of reinvestment of income. A schedule of fees and maximum commissions is available upon request.
COLLECTIVE INVESTMENT SCHEMES
The Sanlam Group is a full member of the Association for Savings and Investment SA. Collective investment schemes are generally medium to long-term investments. Past performance is not a guide to future performance, and the value of investments / units / unit trusts may go down as well as up. A schedule of fees and charges and maximum commissions is available on request from the manager, Sanlam Collective Investments (RF) Pty Ltd, a registered and approved manager in collective investment schemes in securities (‘Manager’).
Collective investments are traded at ruling prices and can engage in borrowing and scrip lending. The manager does not provide any guarantee either with respect to the capital or the return of a portfolio. Collective investments are calculated on a net asset value basis, which is the total market value of all assets in a portfolio including any income accruals and less any deductible expenses such as audit fees, brokerage and service fees. Actual investment performance of a portfolio and an investor will differ depending on the initial fees applicable, the actual investment date, date of reinvestment of income and dividend withholding tax. Forward pricing is used.
The performance of portfolios depend on the underlying assets and variable market factors. Performance is based on NAV to NAV calculations with income reinvestments done on the ex-dividend date. Portfolios may invest in other unit trusts which levy their own fees and may result is a higher fee structure for Sanlam Private Wealth’s portfolios.
All portfolio options presented are approved collective investment schemes in terms of Collective Investment Schemes Control Act, No. 45 of 2002. Funds may from time to time invest in foreign countries and may have risks regarding liquidity, the repatriation of funds, political and macroeconomic situations, foreign exchange, tax, settlement, and the availability of information. The manager may close any portfolio to new investors in order to ensure efficient management according to applicable mandates.
The management of portfolios may be outsourced to financial services providers authorised in terms of FAIS.
TREATING CUSTOMERS FAIRLY (TCF)
As a business, Sanlam Private Wealth is committed to the principles of TCF, practicing a specific business philosophy that is based on client-centricity and treating customers fairly. Clients can be confident that TCF is central to what Sanlam Private Wealth does and can be reassured that Sanlam Private Wealth has a holistic wealth management product offering that is tailored to clients’ needs, and service that is of a professional standard.