Stay abreast of COVID-19 information and developments here
Provided by the South African National Department of Health
Metal vs mine:
which is the better investment?
Economic theory states that in general, it’s better for investors to gain exposure to commodities by investing in the companies mining them rather than in the commodities themselves. Does this also hold true for industries with deep, labour-intensive mines and above-inflation annual cost increases, such as gold and platinum-group metals (PGMs)? We look at the South African gold and PGM industries over the past 30 years – which has been the better investment: the mine or the metal?
Investors wanting exposure to the commodity sector have often been advised to invest in the mining companies instead of the underlying commodities – the main reason being that unlike the metals they mine, the companies have the ability to add value over time. A miner can invest in an asset that produces metal at a low cost and make a high return on the capital invested over the life of the mine. The money made can then be invested in new, profitable projects, or returned to shareholders.
In practice, the reinvestment of capital has often destroyed value – the returns on the invested capital have been below the cost of capital for the mining industry over the past few decades. But in general, mining companies have substantially outperformed the prices of the metals they produce over the longer term.
For example, consider the price of copper and oil compared to that of BHP since 1997 in rand terms. Every R100 invested in BHP (dividends reinvested) yielded R4 740 (19% per year) in 2019, while copper yielded R772 (10% per year) and oil R1 065 (12% per year). What’s more, over not one single 10-year rolling period did the metal outperform BHP.
From a trading perspective, it’s also not always feasible to invest directly in the underlying commodity. Storage costs can be immense. If you invest in a commodity futures contract, the cost of rolling the contract over time can decrease your value materially.
The gold industry in South Africa dates back more than 100 years, and has been shrinking rapidly over the past few decades. In 1995 the industry employed about 380 000 people, but today that number is fewer than 115 000. Like the platinum sector, it’s dominated by deep, labour-intensive mines. The influence of labour unions has resulted in costs increasing at rates of 2–4% above inflation per year for decades, making the industry globally uncompetitive.
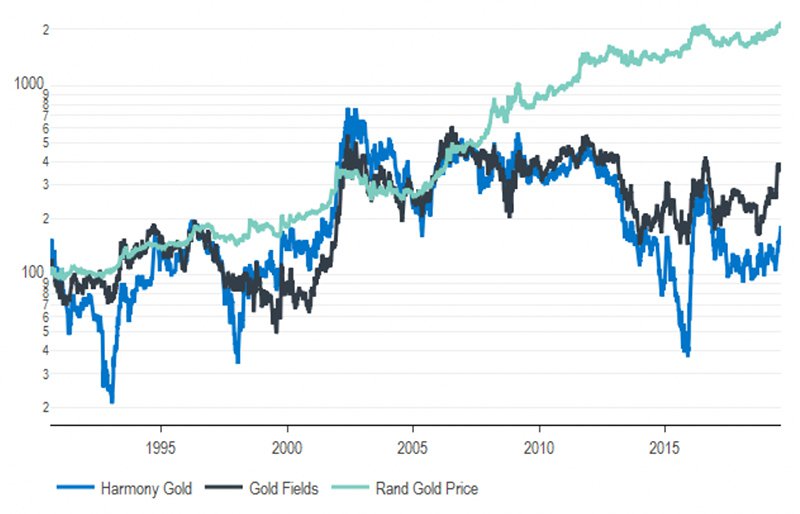
Indeed, when looking at the performance of the rand gold price against that of two of the oldest gold companies in South Africa (excluding AngloGold since it was unbundled from Anglo American only in 1998), the yellow metal far outperformed the miners.
As can be seen on the chart below, if you’d invested R100 in Harmony Gold in 1990 (dividends reinvested), this would be worth a mere R182 today (2.1% per year). An investment of R100 in Gold Fields would have left you with R387 a share (4.7% per year), while R100 in Rand Gold would have yielded R2 194 (11.4% annualised, 5% per year from the dollar gold price and 6% per year from the depreciation of the rand/dollar exchange rate).
Cumulative return of gold companies vs the gold price

Source: Bloomberg, SPW Research
The platinum industry is dominated by supply from South Africa, which provides more than 70% of new mined platinum globally. Like gold mines, South African platinum mines are predominantly situated a few kilometres below surface. The industry has also been plagued by above-inflation annual cost increases. Combined with a static basket price for PGMs (we assume a basket of 60% platinum, 30% palladium and 10% rhodium), this has resulted in metal prices outperforming the mining companies’ share prices over the past 10 years.
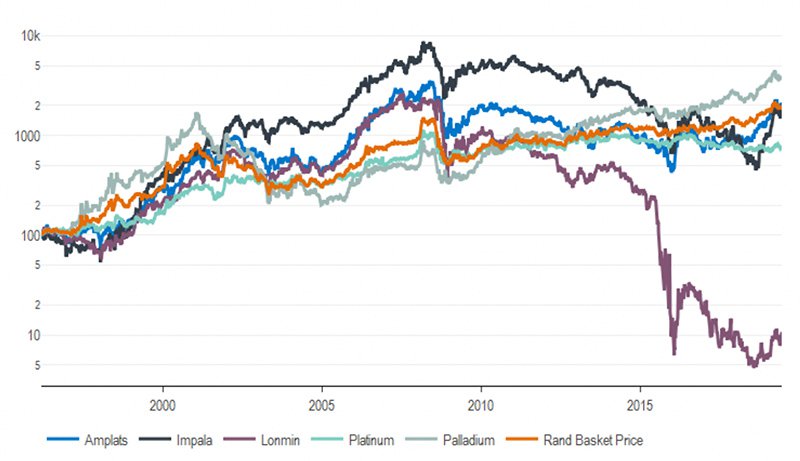
If we look at the PGM industry over a longer time period, however, a slightly different picture emerges. As the chart below shows, from 1996, R100 invested in Impala Platinum, Amplats and Lonmin would now be worth R1 836 (13.5% per year), R2 139 (14.3%) and R10 (-9%) respectively. Lonmin was taken over by Sibanye Stillwater and was no longer listed in June 2019. In contrast, the metal rand basket delivered R1 985 (13.9% per year), roughly in line with Amplats and Impala. Rand palladium delivered 17.4% per year, while platinum delivered only 9.3%.
Cumulative return of platinum companies vs the platinum price

Source: Bloomberg, SPW Research
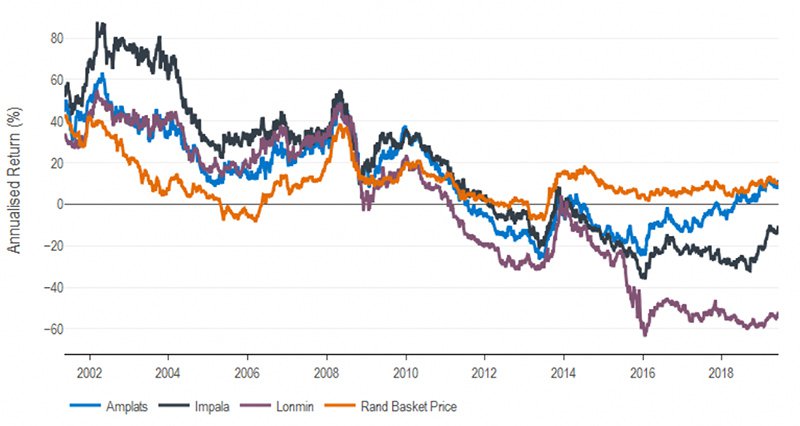
It really is a tale of two decades for the platinum miners, as can be seen in the chart below. From 2000 until the financial crisis in 2009, the miners outperformed the metal basket price over most rolling five-year periods. This can be mostly explained by the rapid adoption of auto catalysts in petrol and diesel vehicles in the late 1990s to early 2000s. However, after the financial crisis, the metal outperformed the company over every five-year rolling period. This is largely the result of a period of demand stagnation, increased secondary supply and large above-inflation cost increases over this decade.
Five-year rolling returns of platinum companies vs the PGM basket price

Source: Bloomberg, SPW Research
Wage negotiations are currently taking place in the PGM industry, and on the back of the recent recovery in palladium and rhodium prices, the miners will struggle to plead innocence with the unions. The Association of Mineworkers and Construction Union (AMCU) has asked for unrealistic wage increases. Based on our sources, we think it likely that they’ll again settle for at least CPI+2% over the next three years, further threatening the longer-term sustainability of the sector.
Concerns over sustainability in these deep conventional mines are reflected in the conduct of industry players. Impala is currently undertaking significant reforms at its main production hub in Rustenburg, where the company plans to cut production by 25% and its workforce by 30%, or 13 000 people. Lonmin has been cutting production over the past three years and is also in the process of reducing its workforce by around 12 600.
With the only open-pit PGM mine in the world, Mogalakwena, Amplats is in the best position in the industry. This palladium-rich deposit has the potential to be significantly expanded, with a resource life of over 100 years. Valuation aside, we prefer Amplats to its rivals in the industry – we own the share indirectly through our position in diversified miner Anglo American, which owns 70% of Amplats.
In the South African gold and PGM industries over the past three decades, it would clearly have been better for an investor to own gold and, in the PGM industry, palladium (trading costs aside), instead of the companies mining them.
This doesn’t mean that investing in gold or PGM companies is never a good investment. We want to avoid the sector over longer time periods, but sometimes it does provide opportunities, as evidenced by the rolling five-year returns of the platinum miners. There have been several five-year periods in which it would have been better to own the company rather than the metal, where the company provided returns of more than 20% per year for five years! The important point is that these companies’ shares should be traded tactically as opposed to being held for the long term.
From an investment perspective, we prefer to gain commodity exposure through diversified miners Anglo American and BHP, as we believe these companies to be more robust and less risky. However, we may from time to time take positions in single-commodity PGM and gold producers if we believe the risks are sufficiently in our favour.
Sanlam Private Wealth manages a comprehensive range of multi-asset (balanced) and equity portfolios across different risk categories.
Our team of world-class professionals can design a personalised offshore investment strategy to help diversify your portfolio.
Our customised Shariah portfolios combine our investment expertise with the wisdom of an independent Shariah board comprising senior Ulama.
We collaborate with third-party providers to offer collective investments, private equity, hedge funds and structured products.
Using your equity portfolio to secure credit allows you fast access to capital.
Sizwe Mkhwanazi has spent 14 years in Investment Management.

Have a question for Sizwe?
South Africa
South Africa Home Sanlam Investments Sanlam Private Wealth Glacier by Sanlam Sanlam BlueStarRest of Africa
Sanlam Namibia Sanlam Mozambique Sanlam Tanzania Sanlam Uganda Sanlam Swaziland Sanlam Kenya Sanlam Zambia Sanlam Private Wealth MauritiusGlobal
Global Investment SolutionsCopyright 2019 | All Rights Reserved by Sanlam Private Wealth | Terms of Use | Privacy Policy | Financial Advisory and Intermediary Services Act (FAIS) | Principles and Practices of Financial Management (PPFM). | Promotion of Access to Information Act (PAIA) | Conflicts of Interest Policy | Privacy Statement
Sanlam Private Wealth (Pty) Ltd, registration number 2000/023234/07, is a licensed Financial Services Provider (FSP 37473), a registered Credit Provider (NCRCP1867) and a member of the Johannesburg Stock Exchange (‘SPW’).
MANDATORY DISCLOSURE
All reasonable steps have been taken to ensure that the information on this website is accurate. The information does not constitute financial advice as contemplated in terms of FAIS. Professional financial advice should always be sought before making an investment decision.
INVESTMENT PORTFOLIOS
Participation in Sanlam Private Wealth Portfolios is a medium to long-term investment. The value of portfolios is subject to fluctuation and past performance is not a guide to future performance. Calculations are based on a lump sum investment with gross income reinvested on the ex-dividend date. The net of fee calculation assumes a 1.15% annual management charge and total trading costs of 1% (both inclusive of VAT) on the actual portfolio turnover. Actual investment performance will differ based on the fees applicable, the actual investment date and the date of reinvestment of income. A schedule of fees and maximum commissions is available upon request.
COLLECTIVE INVESTMENT SCHEMES
The Sanlam Group is a full member of the Association for Savings and Investment SA. Collective investment schemes are generally medium to long-term investments. Past performance is not a guide to future performance, and the value of investments / units / unit trusts may go down as well as up. A schedule of fees and charges and maximum commissions is available on request from the manager, Sanlam Collective Investments (RF) Pty Ltd, a registered and approved manager in collective investment schemes in securities (‘Manager’).
Collective investments are traded at ruling prices and can engage in borrowing and scrip lending. The manager does not provide any guarantee either with respect to the capital or the return of a portfolio. Collective investments are calculated on a net asset value basis, which is the total market value of all assets in a portfolio including any income accruals and less any deductible expenses such as audit fees, brokerage and service fees. Actual investment performance of a portfolio and an investor will differ depending on the initial fees applicable, the actual investment date, date of reinvestment of income and dividend withholding tax. Forward pricing is used.
The performance of portfolios depend on the underlying assets and variable market factors. Performance is based on NAV to NAV calculations with income reinvestments done on the ex-dividend date. Portfolios may invest in other unit trusts which levy their own fees and may result is a higher fee structure for Sanlam Private Wealth’s portfolios.
All portfolio options presented are approved collective investment schemes in terms of Collective Investment Schemes Control Act, No. 45 of 2002. Funds may from time to time invest in foreign countries and may have risks regarding liquidity, the repatriation of funds, political and macroeconomic situations, foreign exchange, tax, settlement, and the availability of information. The manager may close any portfolio to new investors in order to ensure efficient management according to applicable mandates.
The management of portfolios may be outsourced to financial services providers authorised in terms of FAIS.
TREATING CUSTOMERS FAIRLY (TCF)
As a business, Sanlam Private Wealth is committed to the principles of TCF, practicing a specific business philosophy that is based on client-centricity and treating customers fairly. Clients can be confident that TCF is central to what Sanlam Private Wealth does and can be reassured that Sanlam Private Wealth has a holistic wealth management product offering that is tailored to clients’ needs, and service that is of a professional standard.