SA listed property:
opportunity knocks
Last year was truly an ‘annus horribilis’ for South African listed property – since January 2018, the sector has declined by around 20.5% to date. While the pull-back may provide short-term discomfort, selective listed property shares are starting to appear interesting, and in line with our investment philosophy, we’ve begun to invest in preferred stocks as valuations open up. We remain cautious on the sector in general, however.
From March 2003 until December 2017, the JSE South Africa Listed Property Total Return Index (SAPY) returned on average 22.6% annually, outperforming both the All Bond Index (10.1%) and the All Share Total Return Index (14.5%). Since January 2018, however, the SAPY has depreciated by almost 20.5%. For the reasons behind this dramatic decline, see our earlier article.
As can be seen on the graph below, in March 2003, listed property was trading at a yield of over 12%. It was an asset class unloved by the market (read: cheap), and this was the starting point for the performance that followed.

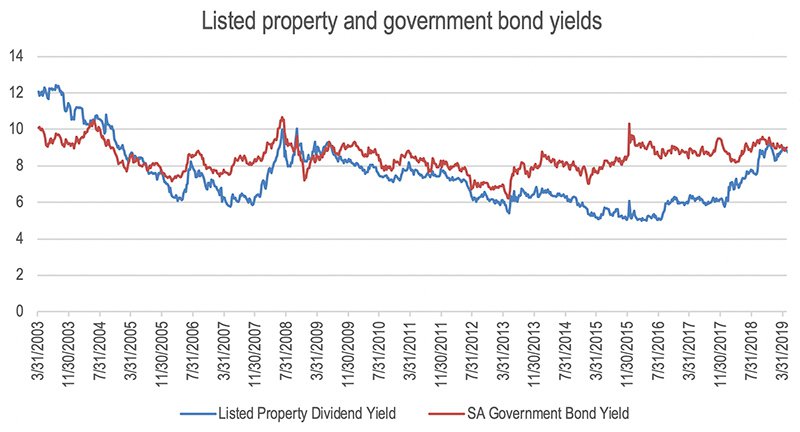
Source: iNet/SPW research
At the moment, the listed property dividend yield is similar to that of the SA government bond yield – the graph shows this ‘confluence’ also occurred in 2003 and 2009. From a ‘top-down’ or macroeconomic view, listed property is therefore now starting to show value relative to bonds. Note, however, that there are important differences between bonds and listed property. This macro view therefore shouldn’t be seen as more than a screening tool to identify relative value – it’s certainly not an indicator of absolute value.
From a bottom-up perspective, there are specific reasons why listed property stocks are trading at these yields – reasons we take into account when we determine the valuation of individual companies. We focus in particular on a company’s ability to grow distributions. In order to do this, it can:
The current economic and operating environment in South Africa – characterised by sluggish economic growth, rising operating costs, struggling consumers, low employment figures and depressed business confidence – is far from ideal for listed property to perform well locally. If the above was a checklist, our local market scores poorly. Additionally, within the office and retail sectors, there is currently an oversupply relative to demand, which will continue to prevent landlords pushing through escalations.
At Sanlam Private Wealth we prefer companies that manage their balance sheets pragmatically and don’t use gearing for the sake of it. Management teams need to be aware of the nature and quality of their assets and have a competitive advantage in the market if they’re to successfully drive distribution growth. Despite bad news being reflected in prices, we’ve come across a few stocks we find interesting:
In the final analysis, property is a cyclical business and price weakness often provides opportunities to invest at attractive yields. We’re starting to see value, but remain cautious about the overall sector given the deteriorating fundamentals, which aren’t likely to improve over the short term. Our preference remains for specialist niche funds with strong balance sheets and growth prospects that are able to extract value from their existing asset base through competitive advantage.
Sanlam Private Wealth manages a comprehensive range of multi-asset (balanced) and equity portfolios across different risk categories:
A different approach to wealth
Partner with Sanlam Private Wealth for clarity, confidence and control over your financial future.
Contact us to schedule a private client consultation.
South Africa
South Africa Home Sanlam Investments Sanlam Private Wealth Glacier by Sanlam Sanlam BlueStarRest of Africa
Sanlam Namibia Sanlam Mozambique Sanlam Tanzania Sanlam Uganda Sanlam Swaziland Sanlam Kenya Sanlam Zambia Sanlam Private Wealth MauritiusGlobal
Global Investment SolutionsCopyright 2019 | All Rights Reserved by Sanlam Private Wealth | Terms of Use | Privacy Policy | Financial Advisory and Intermediary Services Act (FAIS) | Principles and Practices of Financial Management (PPFM). | Promotion of Access to Information Act (PAIA) | Conflicts of Interest Policy | Privacy Statement
Sanlam Private Wealth (Pty) Ltd, registration number 2000/023234/07, is a licensed Financial Services Provider (FSP 37473), a registered Credit Provider (NCRCP1867) and a member of the Johannesburg Stock Exchange (‘SPW’).
MANDATORY DISCLOSURE
All reasonable steps have been taken to ensure that the information on this website is accurate. The information does not constitute financial advice as contemplated in terms of FAIS. Professional financial advice should always be sought before making an investment decision.
INVESTMENT PORTFOLIOS
Participation in Sanlam Private Wealth Portfolios is a medium to long-term investment. The value of portfolios is subject to fluctuation and past performance is not a guide to future performance. Calculations are based on a lump sum investment with gross income reinvested on the ex-dividend date. The net of fee calculation assumes a 1.15% annual management charge and total trading costs of 1% (both inclusive of VAT) on the actual portfolio turnover. Actual investment performance will differ based on the fees applicable, the actual investment date and the date of reinvestment of income. A schedule of fees and maximum commissions is available upon request.
COLLECTIVE INVESTMENT SCHEMES
The Sanlam Group is a full member of the Association for Savings and Investment SA. Collective investment schemes are generally medium to long-term investments. Past performance is not a guide to future performance, and the value of investments / units / unit trusts may go down as well as up. A schedule of fees and charges and maximum commissions is available on request from the manager, Sanlam Collective Investments (RF) Pty Ltd, a registered and approved manager in collective investment schemes in securities (‘Manager’).
Collective investments are traded at ruling prices and can engage in borrowing and scrip lending. The manager does not provide any guarantee either with respect to the capital or the return of a portfolio. Collective investments are calculated on a net asset value basis, which is the total market value of all assets in a portfolio including any income accruals and less any deductible expenses such as audit fees, brokerage and service fees. Actual investment performance of a portfolio and an investor will differ depending on the initial fees applicable, the actual investment date, date of reinvestment of income and dividend withholding tax. Forward pricing is used.
The performance of portfolios depend on the underlying assets and variable market factors. Performance is based on NAV to NAV calculations with income reinvestments done on the ex-dividend date. Portfolios may invest in other unit trusts which levy their own fees and may result is a higher fee structure for Sanlam Private Wealth’s portfolios.
All portfolio options presented are approved collective investment schemes in terms of Collective Investment Schemes Control Act, No. 45 of 2002. Funds may from time to time invest in foreign countries and may have risks regarding liquidity, the repatriation of funds, political and macroeconomic situations, foreign exchange, tax, settlement, and the availability of information. The manager may close any portfolio to new investors in order to ensure efficient management according to applicable mandates.
The management of portfolios may be outsourced to financial services providers authorised in terms of FAIS.
TREATING CUSTOMERS FAIRLY (TCF)
As a business, Sanlam Private Wealth is committed to the principles of TCF, practicing a specific business philosophy that is based on client-centricity and treating customers fairly. Clients can be confident that TCF is central to what Sanlam Private Wealth does and can be reassured that Sanlam Private Wealth has a holistic wealth management product offering that is tailored to clients’ needs, and service that is of a professional standard.