Stay abreast of COVID-19 information and developments here
Provided by the South African National Department of Health
THE DECADE THAT WAS
– WHERE TO NOW?

The third decade of the third millennium has not started quietly. We’re just over a month in, and we’re already on the edge of our seats with a global health emergency resulting from the Wuhan coronavirus outbreak, Brexit Day finally arriving and US president Donald Trump’s impeachment trial. Might the new decade be even more tumultuous than the last one? What does it hold for investors? Crucially, are there any lessons to be learnt from the past 10 years?
The start of the previous decade was marked by unprecedented levels of uncertainty. Investors had been selling off equities aggressively from 2008 as they tried to come to terms with what’s become known as the Global Financial Crisis. There was also ambivalence over how the consequences of the credit crisis would impact real global economic growth and ultimately the profitability of companies and the share price performance of listed entities.
It was unclear whether the economic stimulus on offer would in the long run be able to provide a remedy for a ‘patient’ many economists regarded as being terminally ill: the global banking system. During 2009, equity prices did – albeit hesitantly – recover from the lows recorded at the start of that year. However, investor sentiment was still depressed as we entered 2010, with equity valuations under pressure and global bond yields heading lower as investors searched for safe-haven assets to protect capital.
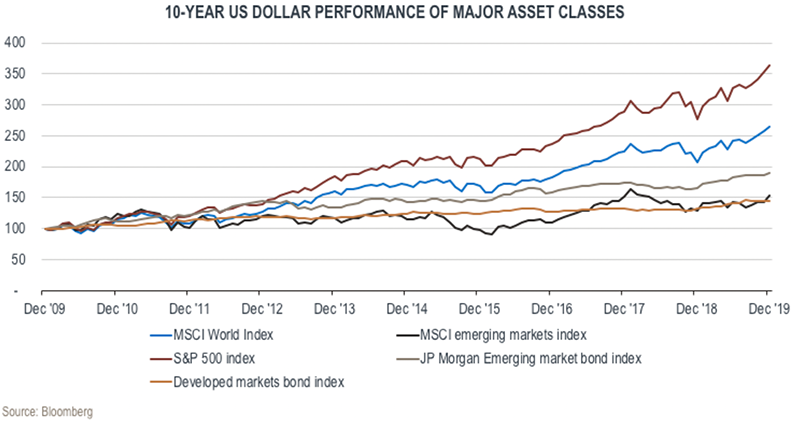
At Sanlam Private Wealth, we’ve always argued that price, or more accurately, low prices, offer the best security for long-term investors. Although no one could foresee this at the time, 2009 did turn out to mark the start of a decade-long bull market for equities, especially in developed markets. The latter enjoyed an equity market return of 10.1% per annum over the 10 years, driven largely by the exceptionally strong performance of US equities – 13.5% as measured by the S&P 500 Index. Emerging market equities recorded a modest performance of 4% per annum, but still outperformed the US consumer inflation index of 1.7% per year over the period.
So-called safe-haven assets fared less well. Global bonds achieved a US dollar return of only 1.8% over the 10 years, substantially lagging emerging market bonds, which returned a healthy 6.5% in US dollars, as seen in the graph below:
The numbers suggest that investment guru Warren Buffett’s view of buying when others are fearful and selling when others are greedy generally does have merit. But at the start of the decade, professional investors having to decide where to put their clients’ money were embroiled in long and stressful debates on the merits of equity investing. Don’t forget that in 2008, Lehman Brothers – the fourth largest investment bank in the US – had to file for bankruptcy after being in business for 158 years. At the time, many investors were questioning the sustainability of the global financial system as we knew it then.
What followed was a 10-year bull market for equities during which the prices of listed shares on average advanced far beyond the forecast of most investment strategists. The advance wasn’t devoid of drama, however. The initial stages of the economic and equity market recovery were supported by very progressive economic policy. Authorities cut interest rates and created liquidity by expanding central bank balance sheets as central banks became buyers of government bonds in a process called quantitative easing.
Many analysts questioned the sustainability of quantitative easing. It represented a significant negative shock to investor expectations, as the US Federal Reserve (the Fed) had become one of the world’s biggest buyers. As is the case with any reduction in demand, with reduced Fed purchases, bond prices fell. Many pundits believed the equity market could follow suit, since money flowing into the economy from the Fed through bond purchases was widely understood to be supporting stock prices. The continuation of the bull trend in global equities came under severe pressure, particularly during 2015.
Global equity prices again found support from the Fed when – in a surprise move – the US central bank cut interest rates in December 2017. The decent earnings growth of US companies over the decade also supported equity prices over the period and provided those who had bought attractively priced assets 10 years earlier, with rich rewards.
Many South African investors who had focused only on local assets, had a somewhat different experience, however. Over the past five years, South African equities yielded only 6% in rand terms, or 2% in US dollar terms. These returns were also associated with high volatility and a background of extreme economic and political policy uncertainty.
But while the past five years were tough for local investors, the performance of the major asset classes over the past 10 years was largely aligned with the risk associated with each asset class. Local equities returned 10.9% per annum over the decade, listed property gained 10.7%, bonds yielded 8.8% and cash delivered 6.5% per year against an inflation number of 5.1%. So despite a disappointing past five years, our clients who had bought local equities when they were cheap 10 years ago would have earned a healthy real return of 5.8% per annum over the past decade.
Investors often expect analysts to provide an outlook for the period ahead, in this case, the next 10 years. We’ve always made it clear that neither Sanlam Private Wealth nor any other investment house has the ability to forecast the future. It’s rather obvious that financial markets are currently very sensitive to interventions by policymakers. The increased intervention experienced over the previous decade has surely dialled up the risk of forecasting. When looking at prospective performance, we therefore continue to be guided, as always, by current valuation levels of the respective asset classes.
Globally, interest rates are low. In fact, we believe global bonds are currently trading in bubble territory. We would therefore assign a very low allocation to this asset class on a 10-year view, despite the fact that it’ll likely continue to act as a safe haven in a crisis. We maintain that given the extremely low yields on cash, global cash doesn’t provide a long-term investment solution for investors.
Following a decade of sterling performance of developed market equities, it’s highly unlikely that investors will experience another decade of 8+% real returns. Although global equity valuations aren’t in bubble territory, they’re by no means cheap and it would therefore be more realistic to dial down return expectations from this asset class.
The South African macro outlook remains cloudy, to say the least. The structural issues that need to be addressed urgently to restore confidence in our economy, are well documented. Whether the current political regime has the will to drive the policy measures that will restore investor confidence, remains to be seen.
However, as mentioned, in our view low prices do provide a measure of safety for long-term investors. Many locally listed companies appear to be currently trading at attractive valuation levels. To put it differently, investors have already penalised local companies for the murky prospects associated with the local economy. We would therefore cautiously favour South African equities in terms of asset allocation – but we’re certainly not suggesting a binary approach or arguing that our clients should invest only in local equities.
South African bonds – another traditional asset class – are also offering attractive yields in real terms. Of course, the sentiment for this asset class is tainted by the rather fragile fiscal outlook for our country. We do believe, however, that these yields should compensate investors for the risk taken in buying South African bonds. Finally, local cash is providing a real pre-tax option.
In a nutshell, given lower starting valuations, the laggards over the past 10 years may well surprise investors. A decade is a long time, however, and within this period, investors are likely to experience continued volatility – but this will provide opportunities for active managers to change the portfolio mix as and when needed to enhance portfolio returns for clients.
Your wealth plan is designed with you in mind. Your financial reality, aspirations and risk profile.
Carl Schoeman has spent 22 years in Investment Management.

Have a question for Carl?


